The U.S. installed 1,330 MW of solar photovoltaics (PV) in the first quarter of 2014 to total 14.8 GW installed capacity, enough to power 3 million homes. In another significant development, Q1 2014 was the largest quarter ever for concentratesd solar power (CSP).
![]()
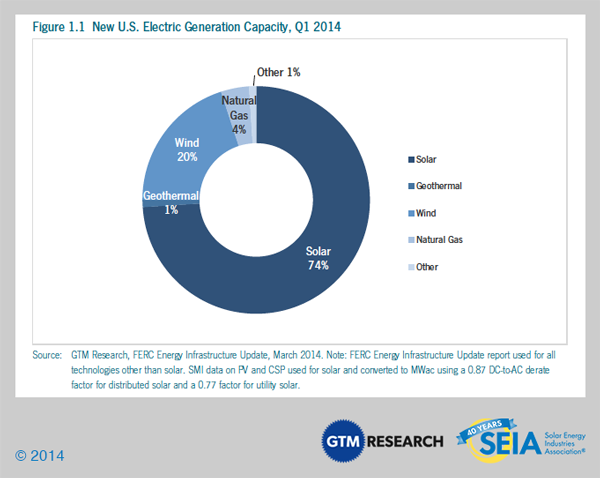
After converting the PV installations into alternating current (AC) and including CSP installations, we reach a total Q1 solar installed capacity of 1,571 MWac. This represents 74% of all new electricity generating capacity installed during the quarter.
![]()
In the distributed solar market, Q1 2014 was the first quarter in recent history in which residential PV installations exceeded commercial installations. While this is partially due to the rough winter slowing construction activity in the commercial-heavy Northeast, it is also emblematic of an ongoing trend in rooftop solar; the residential market has been slowly, steadily gaining steam for years, while the non-residential market has shown more irregular growth. The non-residential market should see stronger growth in the second quarter, once again overtaking residential installations, but our forecast now reflects our view that the residential market will be larger than the non-residential market on an annual basis as soon as 2016.
Of course, there are risks on both sides of our market forecasts. The downside risk in the residential market remains net energy metering and electricity rate structure reform. Although early outcomes in these battlegrounds have been largely favorable for the solar market, we would be remiss to assume that the future will resemble the past. There are more than twenty states with some form of net energy metering legislation or regulation currently in process, and we will be monitoring each one closely. On the non-residential side, there is upside potential in the opportunity to solve a longstanding barrier to growth: the difficulty in financing smaller commercial projects (<250 kWdc). This market has always had massive potential but has suffered from capital constraints; however, there are a number of possible solutions being commercialized today.
Overall, the U.S. solar market is off to a strong start in 2014. Despite some headwinds (which might better be described as strong breezes), we anticipate another year of significant growth. We forecast that 6.6 GWdc of PV will be installed this year, up 39% over 2013 and nearly double the market size in 2012. Aside from the 517 MWac of CSP already brought on-line, an additional 340 MWac of CSP should be completed by the end of the year, making 2014 the largest single year of CSP installations in history.
President Obama has repeatedly highlighted the statistic from this report series that a solar installation in the U.S. is completed every four minutes. If our forecast is accurate, the true rate in 2014 will be a completed solar installation every 2.4 minutes.
![]()
![]()
Collectively, these five states have accounted for 60% to 80% of the entire non-residential market since 2010. For the purposes of this analysis, “commercial” means any commercial, industrial, and agricultural customer and “government/nonprofit” includes any government agency, religious organization, public school and university, or nonprofit. The key distinction between a commercial and government/nonprofit customer lies in a commercial customer’s ability and a government/nonprofit’s inability to take advantage of the 30% federal Investment Tax Credit.
For these top five non-residential state markets, growth rates for government/nonprofit installations significantly outpaced commercial installations in 2013 and Q1 2014. During the last two years, government/nonprofit installations grew year-over-year in all but two quarters, while commercial installations only grew year-over-year in Q3 2012 and Q4 2013. Unlike the residential market, which has increasingly started to operate independently of state incentives, non-residential installation trends remain primarily a function of state incentive availability and market design. Looking out to the second half of 2014 (2H 2014), two state markets in particular present new development opportunities for small-scale government/nonprofit (Massachusetts) and large-scale commercial (New York).
Even more so than distributed solar, the utility PV market has seen significant installation growth concentrated in the final quarter of each year due to extended project development cycles and a rush to complete individual large-scale projects before year’s end to take advantage of the federal investment tax credit. But as Q1 2014’s impressive installation figure demonstrates, developers are in a full steam ahead approach to complete as many projects as possible ahead of the impending reduction of the federal ITC on January 1, 2017. What remains uncertain is whether developers can continue to match their rate of pipeline replenishment with their impressive and expedited build rates.
While pipeline replenishment failed to keep pace with the gigawatt-level surge of installations completed at the end of 2013, the contracted pipeline has since jumped from 11.7 GWdc in Q4 2013 to 12.5 GWdc in Q1 2014. This rebound is primarily linked to factors such as developers’ ability to contract multiple PPAs for the same project in order to deliver power to utilities with pre- and post-2017 RPS obligations; diversification into secondary markets such as Colorado, North Carolina, Georgia, and Texas; and utility PV’s ability to win PPAs as hedges against natural gas price volatility and as part of peak capacity solicitations that directly pit utility PV against natural gas projects.
One reason that we find it valuable to examine these seasonal trends is that they provide perspective on Q1 results. On its own, the 1,330 MWdc installed in the first quarter of this year might appear somewhat weak – every market segment was down relative to Q4 2013. But accounting for seasonal effects provides a more nuanced view of a market that should continue to expand significantly in 2014.
The bottom-up cost methodology is based on tracked wholesale pricing of major solar components and data collected from major installers, with national average pricing supplemented by data collected from system installers and EPCs, along with utility and state programs.
It is important to note that our new price reporting methodology represents an estimated price for a standard PV system within each market segment in the previous quarter. There are many factors that create variations in pricing between systems, including but not limited to special architectural or engineering needs, variations in permitting requirements, the valuation of solar benefits, and market maturity.
In this Q1 2014 U.S. Solar Market Insight report, capacity-weighted average system prices are reported based on state and utility incentive program data for the last time, while also introducing our new national system pricing data for Q1 2014.
According to national weighted average system prices by market segment, residential and utility system prices dropped quarter-over-quarter, while non-residential prices increased over Q4 2013.
Reported residential system pricing from state and utility incentive programs averaged to $4.56/Wdc on a capacity-weighted average basis, with major state markets like California, Arizona and Hawaii reporting figures of $4.73/Wdc, $4.13/Wdc, and $4.50/Wdc, respectively. The lowest reported pricing came from programs in Florida ($3.28/Wdc), Washington, D.C. ($3.55/Wdc), and Texas ($3.59/Wdc), whereas high pricing came from outlier programs in Minnesota ($9.07/Wdc) and Wisconsin ($5.68/Wdc).
As stated previously, these figures are subject to a number of factors that render the analysis insufficient for determining the actual industry costs during the quarter reported. These factors include:
As a further step, we have built a bottom-up model of residential system costs that better elucidates component and categorical costs for PV systems built during the quarter. Due to the data sources for this information, these costs are reflective of EPC pricing on standard systems for firms installing a total of more than 1 MWdc (~150 systems) per quarter. For residential PV systems, our breakdown reflects the following parameters:
Forecast details by state (30 states) and market segment through 2018 are available in the Full Report.
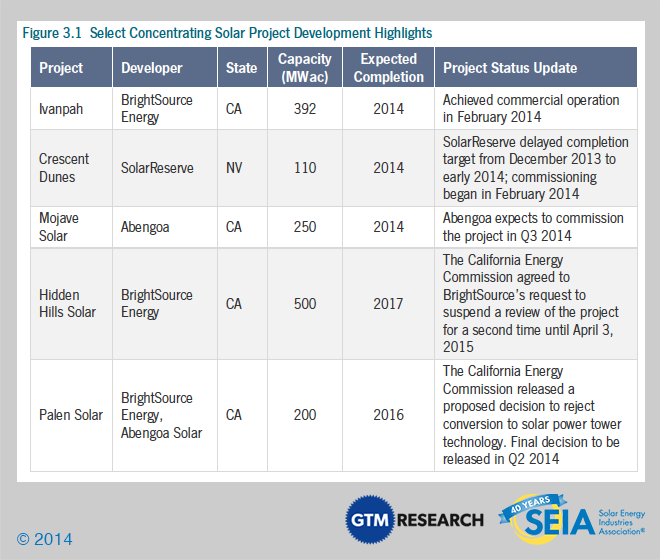
The next notable project slated for completion is SolarReserve’s 110 MWac Crescent Dunes, which entered the commissioning phase in February 2014. Major CSP project development highlights in Q1 2014 can be found in the following table.
![]()
http://www.helioscsp.com/noticia.php?id_not=2519
worldwatch@nodo50.org
Key Figures
- The U.S. installed 1,330 MWdc of solar PV in Q1 2014, up 79% over Q1 2013, making it the second-largest quarter for solar installations in the history of the market.
- Cumulative operating PV capacity stood at 13,395 MWdc, with 482,000 individual systems on-line as of the end of Q1 2014.
- Growth was driven primarily by the utility solar market, which installed 873 MWdc in Q1 2014, up from 322 MWdc in Q1 2013.
- Q1 2014 was the first time residential PV installations exceeded non-residential (commercial) installations nationally since 2002.
- For the first time ever, more than 1/3 of residential PV installations came on-line without any state incentive in Q1 2014.
- Q1 2014 saw school, government, and nonprofit PV installations add more than 100 MWdc for the second straight quarter.
- 74% of new electric generating capacity in the U.S. in Q1 2014 came from solar.
- We forecast that PV installations will reach 6.6 GWdc in 2014, up 39% over 2013 and nearly double the market size in 2012.
- Q1 2014 was the largest quarter ever for concentrating solar power due to the completion of the 392 MWac Ivanpah project and Genesis Solar project’s second 125 MWac phase. With a total of 857 MWac expected to be completed by year’s end, 2014 will likely be the largest year for CSP in history.
- Cumulative operating CSP capacity was 1,435 MWac as of the end of Q1 2014.
After converting the PV installations into alternating current (AC) and including CSP installations, we reach a total Q1 solar installed capacity of 1,571 MWac. This represents 74% of all new electricity generating capacity installed during the quarter.
In the distributed solar market, Q1 2014 was the first quarter in recent history in which residential PV installations exceeded commercial installations. While this is partially due to the rough winter slowing construction activity in the commercial-heavy Northeast, it is also emblematic of an ongoing trend in rooftop solar; the residential market has been slowly, steadily gaining steam for years, while the non-residential market has shown more irregular growth. The non-residential market should see stronger growth in the second quarter, once again overtaking residential installations, but our forecast now reflects our view that the residential market will be larger than the non-residential market on an annual basis as soon as 2016.
Of course, there are risks on both sides of our market forecasts. The downside risk in the residential market remains net energy metering and electricity rate structure reform. Although early outcomes in these battlegrounds have been largely favorable for the solar market, we would be remiss to assume that the future will resemble the past. There are more than twenty states with some form of net energy metering legislation or regulation currently in process, and we will be monitoring each one closely. On the non-residential side, there is upside potential in the opportunity to solve a longstanding barrier to growth: the difficulty in financing smaller commercial projects (<250 kWdc). This market has always had massive potential but has suffered from capital constraints; however, there are a number of possible solutions being commercialized today.
Overall, the U.S. solar market is off to a strong start in 2014. Despite some headwinds (which might better be described as strong breezes), we anticipate another year of significant growth. We forecast that 6.6 GWdc of PV will be installed this year, up 39% over 2013 and nearly double the market size in 2012. Aside from the 517 MWac of CSP already brought on-line, an additional 340 MWac of CSP should be completed by the end of the year, making 2014 the largest single year of CSP installations in history.
President Obama has repeatedly highlighted the statistic from this report series that a solar installation in the U.S. is completed every four minutes. If our forecast is accurate, the true rate in 2014 will be a completed solar installation every 2.4 minutes.
2. Photovoltaics
2.1. Installations
The U.S. installed 1,330 MWdc of solar PV in the first quarter of 2014, down 37% from Q4 2013 but up 79% over Q1 2013. This represents the second-largest quarter in the history of the U.S. market and by far the largest Q1 in the market’s history.

Nearly two-thirds of the capacity installed in the first quarter came from the utility market, which installed 873 MWdc. This compares to a utility market share of 60% over the course of 2013. Q1 2014 was also the first quarter since 2002 in which the residential market installed more PV (232 MWdc) than the commercial/non-residential market (225 MWdc). This reflects ongoing strength in the residential sector (despite an incremental quarterly decline) and continued malaise in the commercial market. However, part of the Q1 sluggishness in commercial installations was due to the harsh winter, and we anticipate that the non-residential market will rebound later in the year and ultimately exceed the residential market on an annual basis.

Residential
Key Figures- Up 38% over Q1 2013
- Down 11% from Q4 2013
Non-Residential
- Down 12% from Q1 2013
- Down 44% over Q4 2013
Collectively, these five states have accounted for 60% to 80% of the entire non-residential market since 2010. For the purposes of this analysis, “commercial” means any commercial, industrial, and agricultural customer and “government/nonprofit” includes any government agency, religious organization, public school and university, or nonprofit. The key distinction between a commercial and government/nonprofit customer lies in a commercial customer’s ability and a government/nonprofit’s inability to take advantage of the 30% federal Investment Tax Credit.
For these top five non-residential state markets, growth rates for government/nonprofit installations significantly outpaced commercial installations in 2013 and Q1 2014. During the last two years, government/nonprofit installations grew year-over-year in all but two quarters, while commercial installations only grew year-over-year in Q3 2012 and Q4 2013. Unlike the residential market, which has increasingly started to operate independently of state incentives, non-residential installation trends remain primarily a function of state incentive availability and market design. Looking out to the second half of 2014 (2H 2014), two state markets in particular present new development opportunities for small-scale government/nonprofit (Massachusetts) and large-scale commercial (New York).
- Massachusetts: Beginning in 2H 2014, the second state SREC program will take effect and offer higher SREC production factors for projects of 650 kWdc or less and with solar carports, with demand for the latter primarily being driven by large educational offtakers. Meanwhile, SREC II will limit annual development opportunities for commercial projects larger than 650 kWdc as part of a “managed growth” sector, capped at 26 MWdc in 2014.
- New York: NYSERDA has restructured its next incentive program for non-residential PV projects above 200 kWdc by condensing the number of incentive payment schemes from two upfront rebates and a production-based incentive (PBI) for the first three years of system production to one upfront rebate and a PBI for the first two years of production. Expect this incentive reform to ease large-scale commercial developers’ access to financing by allowing them to monetize the upfront rebates with lower transaction costs and capture all PBI payments one year sooner than was previously allowed.
Utility PV
- 873 MWdc installed in Q1 2014
- Second-largest quarter ever for utility PV (ranking behind Q4 2013)
Even more so than distributed solar, the utility PV market has seen significant installation growth concentrated in the final quarter of each year due to extended project development cycles and a rush to complete individual large-scale projects before year’s end to take advantage of the federal investment tax credit. But as Q1 2014’s impressive installation figure demonstrates, developers are in a full steam ahead approach to complete as many projects as possible ahead of the impending reduction of the federal ITC on January 1, 2017. What remains uncertain is whether developers can continue to match their rate of pipeline replenishment with their impressive and expedited build rates.
While pipeline replenishment failed to keep pace with the gigawatt-level surge of installations completed at the end of 2013, the contracted pipeline has since jumped from 11.7 GWdc in Q4 2013 to 12.5 GWdc in Q1 2014. This rebound is primarily linked to factors such as developers’ ability to contract multiple PPAs for the same project in order to deliver power to utilities with pre- and post-2017 RPS obligations; diversification into secondary markets such as Colorado, North Carolina, Georgia, and Texas; and utility PV’s ability to win PPAs as hedges against natural gas price volatility and as part of peak capacity solicitations that directly pit utility PV against natural gas projects.
2.1.2. Seasonal Trends
Seasonal effects consistently play a major role in U.S. solar installation patterns. Every market segment in the U.S. tends to see a meaningful increase in installations in the fourth quarter. The residential market tends to grow incrementally throughout the year, whereas the non-residential and utility markets see slower growth early in the year and an even larger increase in Q4. Figure 2.6 shows average quarterly installations as a percentage of the annual total in each market segment over the past four years.One reason that we find it valuable to examine these seasonal trends is that they provide perspective on Q1 results. On its own, the 1,330 MWdc installed in the first quarter of this year might appear somewhat weak – every market segment was down relative to Q4 2013. But accounting for seasonal effects provides a more nuanced view of a market that should continue to expand significantly in 2014.
2.2. National System Pricing
Starting this quarter, we have added bottom-up system cost modeling as a supplement to reported national system pricing. Our previous methodology used capacity-weighted average system pricing directly from utility and state incentive programs, but we have long felt that the data presented an out-of-date view of the market, as it often represented systems quoted in quarters well prior to the installation and connection date.The bottom-up cost methodology is based on tracked wholesale pricing of major solar components and data collected from major installers, with national average pricing supplemented by data collected from system installers and EPCs, along with utility and state programs.
It is important to note that our new price reporting methodology represents an estimated price for a standard PV system within each market segment in the previous quarter. There are many factors that create variations in pricing between systems, including but not limited to special architectural or engineering needs, variations in permitting requirements, the valuation of solar benefits, and market maturity.
In this Q1 2014 U.S. Solar Market Insight report, capacity-weighted average system prices are reported based on state and utility incentive program data for the last time, while also introducing our new national system pricing data for Q1 2014.
According to national weighted average system prices by market segment, residential and utility system prices dropped quarter-over-quarter, while non-residential prices increased over Q4 2013.
- From Q1 2013 to Q1 2014, residential system prices fell 7%, from $4.91/W to $4.56/W. Quarter-over-quarter, installed prices declined by 1%. Installed prices came down in most major residential markets including California, Arizona, Massachusetts, and New York.
- Non-residential system prices fell 5.7% year-over-year, from $3.95/W to $3.72/W, while quarter-over-quarter installed costs increased by 4%. Higher priced government/nonprofit projects accounted for the majority of installations across the top five non-residential markets, which include California, Arizona, Massachusetts, New Jersey, and New York.
- Utility system prices once again declined quarter-over-quarter and year-over-year, down from $2.14/W in Q1 2013 and $1.96/W in Q4 2013, settling at $1.85/W in Q1 2014.
2.2.1. National Residential System Pricing
Note: Detailed information about national system prices by market segment are available in the Full Report.Reported residential system pricing from state and utility incentive programs averaged to $4.56/Wdc on a capacity-weighted average basis, with major state markets like California, Arizona and Hawaii reporting figures of $4.73/Wdc, $4.13/Wdc, and $4.50/Wdc, respectively. The lowest reported pricing came from programs in Florida ($3.28/Wdc), Washington, D.C. ($3.55/Wdc), and Texas ($3.59/Wdc), whereas high pricing came from outlier programs in Minnesota ($9.07/Wdc) and Wisconsin ($5.68/Wdc).
As stated previously, these figures are subject to a number of factors that render the analysis insufficient for determining the actual industry costs during the quarter reported. These factors include:
- Various definitions of “cost” that may or may not be inclusive of fair market valuation and other components that do not necessarily reflect the true cost of solar installations
- Dated reporting of system pricing, reflecting quotes from as much as a year previous to the installation date
- Pricing for systems installed outside of state and utility incentive programs are not accounted for
As a further step, we have built a bottom-up model of residential system costs that better elucidates component and categorical costs for PV systems built during the quarter. Due to the data sources for this information, these costs are reflective of EPC pricing on standard systems for firms installing a total of more than 1 MWdc (~150 systems) per quarter. For residential PV systems, our breakdown reflects the following parameters:
- 6.5 kWdc residential system
- Standard multicrystalline silicon PV modules
- 6 kWac string inverter with integrated DC disconnect
- Standard rail-and-clamp racking system with flashed mounting
- Rectangular array on composite shingle roof
- PV module and inverters reflect “factory-gate” pricing with distribution and low volume markups reflected in the supply chain category
2.3. Component Pricing: Polysilicon, Wafers, Cells and Modules
Note: Detailed component pricing, including inverters and mounting structures, is available in the Full Report.2.3.1. Delivered U.S. Module Pricing, 1-5 MWdc Order, Q1 2014
Module pricing in the U.S. differs widely based on order volume, producer region, individual firm, and sales channel (direct vs. distributor). Delivered prices for Chinese modules in Q1 2014 ranged from $0.66/Wdc on the low side (corresponding to order volumes larger than 10 MWdc for less established firms) to $0.74/W on the high side (established, bankable firms, order volumes less than 1 MWdc). Blended delivered pricing for Chinese modules was estimated at $0.72/Wdc, which represented a 3% increase quarter-over-quarter, and a 14% increase year-over-year. This has largely been due to a significant increase in the price of Taiwanese cells (which are used in Chinese-assembled modules shipped to the U.S. to avoid tariffs placed on Chinese cells) over this period. Prices for European, U.S. and Japanese modules (selling mostly into the residential and small commercial sector) were notably higher at $0.78-$0.85/Wdc. A few Taiwanese and Korean suppliers were offering pricing in between these two points ($0.75-$0.80/Wdc), albeit at limited volumes.2.4. Market Outlook
We expect another strong year for the U.S. PV market in 2014, with installations reaching 6.6 GWdc, a 33% increase over 2013. The fastest growth will come from the residential segment (61% year-over-year), followed by the non-residential segment (41%) and the utility segment (32%). We have increased our forecasts this quarter, primarily in the residential segment (especially in California and New York), as well as the utility segment (thanks to greater pipeline visibility).Forecast details by state (30 states) and market segment through 2018 are available in the Full Report.
3. Concentrating Solar Power
The final quarter of 2013 kicked off the first wave of mega-scale CSP projects to be completed over the next few years, and Q1 2014 built on that momentum with 517 MWac brought on-line. This includes BrightSource Energy’s 392 MWac Ivanpah project and the second and final 125 MWac phase of NextEra’s Genesis solar project.The next notable project slated for completion is SolarReserve’s 110 MWac Crescent Dunes, which entered the commissioning phase in February 2014. Major CSP project development highlights in Q1 2014 can be found in the following table.
http://www.helioscsp.com/noticia.php?id_not=2519
worldwatch@nodo50.org