Quantcast
Channel: José Santamarta Flórez
Viewing all 10472 articles
Browse latest View live

Enel brings two new South African PV plants

$
0
0
Enel, through its renewable energy subsidiary Enel Green Power RSA (EGP RSA), has brought the 82.5 MW Adams and Pulida solar PV plants, which are respectively located in South Africa’s Northern Cape and Free State provinces, into commercial operation. 


“Enel Green Power RSA’s two new solar projects were completed ahead of schedule, according to the highest levels of quality and safety and in full alignment with our commitment to the country’s social and economic development,” said William Price, Enel’s Country Manager in South Africa. “Together with our local project partners, Enel Green Power RSA’s renewable energy projects are already making a significant contribution to the country’s economy, and these two new solar facilities are expected to add further value to those efforts.”

Together, Adams and Pulida will be able to generate 318 GWh per year, equivalent to the annual consumption needs of around 100,000 South African households, while avoiding the emission of more than 290,000 tonnes of CO2 into the atmosphere each year.

The two solar plants are supported by a 20-year power supply agreement with South African power utility Eskom, which Enel was awarded in 2014 following the third round of the Renewable Energy Independent Power Producer Procurement Programme (REIPPPP) tender promoted by the South African government.

EGP RSA currently owns and operates three other PV plants in South Africa: Paleisheuwel (82.5 MW), which is situated in the Western Cape province, Tom Burke (66 MW) in the Limpopo province and Upington (10 MW), which is located in the Northern Cape province. The company also operates the 88 MW Nojoli wind farm in the Eastern Cape, where it is also building the 111 MW Gibson Bay wind facility.


¿A quién amenazan los vehículos eléctricos?

$
0
0
El auge de los coches eléctricos y la consiguiente caída del consumo de petróleo son una seria amenaza para el sector a medio plazo, advierten los expertos, un riesgo subestimado hasta ahora por las grandes petroleras.

Según un informe publicado por los gabinetes Carbon Tracker y Grantham Institute, ambos con sede en Londres, la caída de los precios de los coches eléctricos y de las energías renovables podría frenar la demanda de petróleo a partir de 2020.
A partir de 2025, si el sector de los coches eléctricos sigue su ritmo de expansión actual, la demanda de petróleo podría caer en dos millones de barriles diarios, según el informe, una cifra similar a la que en 2014 hundió el mercado petrolero.
Y para 2035 esa caída podría multiplicarse por cinco, en un mundo donde los coches eléctricos representarán más del 30% del mercado, augura el informe.
El sector de la energía y el transporte por carretera representa la mitad del consumo de energías fósiles, por lo que el aumento de la energía solar y de los vehículos eléctricos tendrá un gran impacto en la demanda.
"Muy pocas compañías o instituciones de la industria energética están considerando el cambio que supondrá la explosión de esta tecnología y su crecimiento exponencial", afirma a la AFP Luke Sussams, un analista de Carbon Tracker.
Es el caso de BP, uno de los gigantes mundiales del petróleo y el gas, que la semana pasada predijo en su informe anual que la demanda de crudo para combustible para coches seguirá creciendo más allá de 2035.
Ese año, según los cálculos de la multinacional, los coches eléctricos solo representarán un 6% del parque global, mucho menos que los datos de Carbon Tracker y Grantham Institute.
Un optimismo compartido por muchas compañías petroleras  contradice la tendencia que marca el informe y otros analistas exteriores a la industria.
No hay acuerdo sin embargo sobre el ritmo de crecimiento del sector del automóvil eléctrico.
La Agencia Internacional de la Energía (AIE), creada en 1973 tras el choque petrolero, augura que será modesto, con un 8% del parque mundial -unos 150 millones de vehículos- en 2040 y que provocará una caída de la demanda de solo 1.3 millones de barriles al día.
Pero la AIE no siempre ha acertado en sus previsiones. "La AIE y las compañías petroleras todavía no están al día en energías renovables", asegura Sussams, que cree que son demasiado conservadores en sus cálculos.
Al contrario, un estudio de de Bloomberg New Energy Finance augura una cuota de mercado importante, del 22%, para los coches eléctricos en 2035.
"Calculamos que a partir de 2020 los vehículos eléctricos serán más baratos que los de combustión fósil" explica Sussams para justificar las previsiones de su estudio.
El modelo de cálculo de Carbon Tracker también parte de la hipótesis de un crecimiento rápido del sector y de la ausencia de obstáculos para su desarrollo, como la escasez de estaciones de recarga.
En 2016 China, el mayor mercado del mundo para los coches eléctricos, vendió mas de medio millón de vehículos.
El informe de 60 páginas publicado el miércoles, titulado "El poder disruptivo de la tecnología de bajo carbono", recuerda que la industria minera en Estados Unidos se hundió por una caída del 10% en la cuota de mercado de esta energía.
En Europa cinco grandes compañías energéticas perdieron cerca de 105.000 millones de dólares entre 2008 y 2013 "porque no estaban preparadas para el crecimiento de un 8% de las energías renovables", advierte Sussams.


WindEurope launches Daily Wind Power Numbers

$
0
0
WindEurope launches a unique digital platform in the presence of European Commission Vice-President Šefčovič. 

The Daily Wind Power Numbers platform will inform policy makers, stakeholders and citizens every day on:
  • the share of wind in yesterday’s power mix in Europe, broken down by Member State;
  • yesterday’s hourly electricity mix (all fuels and technologies), again broken down by Member State; and
  • yesterday’s capacity factors for wind across Europe.
The information in the Daily Wind Power Numbers platform comes from 13,000 data points gathered from Transmission System Operators, power exchanges, Eurostat and WindEurope statistics. All subscribers to the platform will receive a daily email with the data headlines and a link to the previous day’s data.
Daily Wind Power Numbers

The platform explained

Europe is a global leader in wind energy. The first tab of the tool shows that wind energy powers millions of European households and businesses every day. Last year wind energy covered 10.4% of EU power demand. And on some days, it covered more than 100% of some Member State’s electricity demand.
Wind power is a reliable partner in almost every Member State. The second tab presents the top countries in generating on- and offshore wind energy on the day before. The ranking changes with weather and market conditions.
As a mainstream technology, wind power fully competes with conventional plants. By clicking on the third tab, you can get an idea of a Member State’s energy mix – per hour.
Wind varies, but it is always blowing somewhere in Europe. Tab four supports the case of a functioning internal energy market that increases cross-border trade and enhances security of supply. See a map of Europe’s most powerful connections.
Member States with windy conditions do not yet fully tap the potential. The higher the capacity factor in tab five the more wind energy was generated. Browse our statistics to see how many turbines your country has.

Next steps


Wind energy in Argentina: Vestas wind turbines for a wind farm

$
0
0
Vestas has received a firm and unconditional order from Greenwind S.A, a subsidiary of Pampa Energía, one of the largest power companies in Argentina, to supply 29 V126-3.45 MW turbines for the 100 MW Corti wind park in the Bahía Blanca, Argentina.

The order is an Engineering, Procurement and Construction (EPC) contract and comprises supply, installation, civil works and commissioning of the wind turbines. A 10-year Active Output Management 5000 (AOM5000) service agreement is also included to ensure optimal operation of the wind farm at all times. Turbine delivery is planned for the third quarter of 2017, while commissioning is expected for the second quarter of 2018.
President of Vestas Mediterranean, Marco Graziano, comments, “In 2011, Vestas built Argentina’s largest wind park and we are pleased to see that wind energy is once again growing in the country. This order underlines the momentum our 3 MW platform has achieved in Argentina and demonstrates that Vestas’ turbines are well-suited for the variety of sites across the country”.
Argentina has committed to reach 20 percent renewable energy by the end of 2025 and recently passed the Argentinian Renewable Energy Law, which requires large electricity consumers to get a minimum of eight percent of its power production from renewable sources.
To meet the increasing demand in Argentina, Vestas opened an office in Buenos Aires in 2016 and received orders from a number of customers, including Genneia S.A. and YPF Energía Eléctrica S.A. a subsidiary of YPF oil company.


Canada’s wind energy industry had another year of strong growth in 2016, adding 702 MW of new capacity

$
0
0
Canada’s wind energy industry had another year of strong growth in 2016, adding 702 MW of new capacity through the commissioning of 21 projects in Ontario, Quebec and Nova Scotia. Sixteen of these projects are owned, at least in part, by aboriginal or local communities, or municipal governments. Canada now has 11,898 MW of installed wind generation capacity, enough to supply six percent of Canada’s electricity demand and meet the annual electricity needs of more than three million homes.

Wind energy and natural gas are the two most cost-competitive sources of new electricity generation in Canada today and wind energy has been the largest source of new electricity generation in Canada since 2005. Between 2012 and 2016, Canada’s installed wind energy capacity has grown by an average of 18 per cent, or 1,327 MW annually.
The Canadian Wind Energy Association (CanWEA) expects Canada to install approximately 700 MW of new wind energy capacity in 2017. New wind energy procurement in Alberta and Saskatchewan in 2017, coupled with a renewed focus in Canada on actions to transition to a low carbon economy, mean that wind energy’s growth prospects will remain strong in Canada for many years to come.
http://y2ep68jqeo-flywheel.netdna-ssl.com/wp-content/uploads/2017/01/8-canwea-infographic2016-wind-energy-growth-in-2016-canada.jpg
“More wind energy has been built in Canada in the last 11 years than any other form of electricity generation, and for good reason,” said Robert Hornung, President of CanWEA. “Costs for wind energy have fallen dramatically over the past seven years, making wind energy one of Canada’s two most cost-competitive sources of new electricity supply. And unlike natural gas, wind energy is not impacted by carbon prices or commodity price fluctuations, meaning that wind energy will only become more affordable over time. The fact that the vast majority of new wind energy projects built in Canada in 2016 had some form of local ownership demonstrates the value of wind not only as a driver of economic growth, but also as a source of local jobs and revenue in communities right across the country.”
Facts
  • Ontario continued to lead Canada in market size and growth, adding 413 MW of new wind energy capacity in 2016 to bring its total installed capacity to 4,781 MW.
  • Quebec added three projects totalling 249 MW of capacity in 2016, ending the year with 3,510 MW of wind energy on its grid and maintaining its position as the second largest wind energy market in Canada.
  • Nova Scotia installed more wind energy projects than any other province in 2016, with 10 new facilities totalling 39.5 MW coming on line, most driven by the province’s unique community feed-in tariff program. Nova Scotia ended the year with 579 MW of wind energy capacity, placing it fourth among the provinces for total installed capacity.
  • Canada’s new wind energy projects in 2016 represented about $1.5 billion in investment.
  • There are now 285 wind farms made up of 6,288 wind turbines operating in Canada, bringing economic development and diversification to well over 100 rural communities through land lease income, property tax payments, ownership revenue and community benefits agreements.
  • Canada’s first commercial wind facility, the Cowley Ridge Wind Farm, was decommissioned in 2016, 23 years after it began operations in southern Alberta in 1993. Alberta added no new wind capacity last year, but remains Canada’s third largest wind market with 1,479 MW.
Background
Levelized Cost of Energy Analysis 10.0, published in Nov. 2016 by the financial advisory firm Lazard, shows how the cost of wind energy has fallen 66 per cent over the past seven years in the United States.
National Energy Board statistics (appendices: electricity capacity) show more wind energy was built in Canada than any other source of electricity generation from 2005 to 2015
CanWEA’s Wind Markets webpages contain detailed information on the role of wind energy in markets across Canada.


Nordex grows in Germany

$
0
0
The Nordex Group installed substantially more wind turbines – 267 units – in its domestic market in 2016 than in the previous year (2015: 176). This growth of around 50% slightly exceeded the internal budget. As the capacity of these turbines also rose, installed capacity climbed by an even sharper 58% over the previous year to 691 MW (2015: 437 MW). Average capacity per wind power system increased to around 2.6 MW (2015: 2.5). 


Nordex outperformed the industry as a whole, which posted gains of almost 24% to 4,625 MW (2015: 3,730 MW). This strong market development was driven by the adoption of an auction model for the remuneration of new projects. Consequently, Nordex’s market share increased to around 15% (2015: 12%).

Nordex particularly benefited from its strong position in efficient turbines designed for light-wind regions (IEC3). Thus, more than 40% of its turbines were installed in the four southern German states of Bavaria, Baden-Württemberg, Rhineland-Palatinate and Saarland. At the same time, the share of the more recent 3-MW platform doubled to over 25% (2015: 12%).

“This year we will achieve a new installation record thanks to the strong order intake in 2016,” says Jörg Hempel, who is responsible for Nordex’s German business. Last year, Nordex’s order intake in Germany rose by around 28% to EUR 1.17bn. 


GE Announces Record Onshore Wind Energy Orders for 2016

$
0
0
GE Renewable Energy today announced it secured over 7 GW in onshore wind orders in 2016. The company had previously announced that GE’s Onshore Wind business booked over $3B of orders in the fourth quarter alone, partly thanks to a strong market in the US.

As part of these record results, GE Renewable Energy’s Onshore Wind signed agreements in 19 countries around the world, including orders in Japan, India and Germany. The business also booked orders in Greece and Saudi Arabia for the first time ever. GE’s onshore wind installed base now stands at nearly 57,000 MW of global capacity.
Jérôme Pécresse, President and CEO of GE Renewable Energy said “Developing a strong relationship with our global customers and anticipating their local needs helps us to maintain a leading industry position and meet the growing demand. We are thrilled with the customer response to investments the Onshore Wind team made in developing new products and solutions, especially in the US where our new platform is contributing ~75% of our orders in 2016.”
GE’s growth in onshore wind globally included several milestones the company previously announced in 2016, including:
  • GE successfully completed construction of the first of a three-phase wind project in southeast India, installing 30 units of GE’s 1.7-103 technology. Mytrah Energy Limited’s Aspari I, the first 51 MW of a planned 200 MW project, is now erected and ready for commissioning. The project utilizes GE’s new Energy Forecasting application, part of its Digital Wind Farm ecosystem.
  • In Germany, GE Renewable Energy signed its largest wind collaboration in the country to date, a framework agreement with UKA Group to install approximately 250 MW of wind energy across 12 future project sites throughout Germany. GE also signed a Turbine Supply Agreement with Max Bögl Wind AG to deliver and commission the world’s tallest and first ever wind turbine integrated with pumped storage hydro-electric power.
  • GE secured a five-year Digital Wind Farm services contracts for two wind farms in central Japan. Utilizing GE’s prognostics and PowerUp service applications, along with hardware and software enhancements, this will help the turbines run more efficiently and increase overall plant production by up to five percent.
  • In Turkey, GE signed deals for 120MW of installed capacity, including 70MW of brilliant turbines with Dost Enerji for their Bergama Wind Power Plant site.
  • GE also saw significant growth in the United States, with its 2 MW platform.

GE Renewable Energy is a 10 billion dollar start-up that brings together one of the broadest product and service portfolios of the renewable energy industry. Combining onshore and offshore wind, hydro and innovative technologies such as concentrated solar power, GE Renewable Energy has installed more than 400+ gigawatts capacity globally to make the world work better and cleaner. With 13,000 employees present in more than 55 countries, GE Renewable Energy is backed by the resources of the world’s first digital industrial company. Our goal is to demonstrate to the rest of the world that nobody should ever have to choose between affordable, reliable, and sustainable energy.


Gamesa suministrará los aerogeneradores del primer parque eólico de Indonesia

$
0
0
Gamesa, líder tecnológico global en la industria eólica, ha firmado un acuerdo con el promotor PT UPC Sidrap Bayu Energi –joint venture entre UPC Renewables, PT Binatek y AC Energy Holdings- para suministrar 75 MW al primer parque eólico que se pondrá en marcha en Indonesia, un país con un alto potencial para la energía eólica.
Este acuerdo supone también un hito comercial y de producto para Gamesa, ya que son los primeros aerogeneradores del modelo G114-2.5 MW que instalará en la región de Asia-Pacífico. Además, estas turbinas pueden alcanzar los 2,625 MW bajo ciertas condiciones técnicas.


En concreto, la compañía pondrá en marcha 30 aerogeneradores en el parque eólico Sidrap, localizado en la isla de Sulawesi. La entrega de las máquinas se llevará a cabo en el tercer trimestre de este año y su puesta en marcha durante el primer trimestre de 2018.

Este proyecto forma parte del plan del Gobierno para alcanzar los 35 GW de capacidad en 2019, combinando fuentes tradicionales y renovables. Además, en el largo plazo su meta es que el 23% de la producción proceda de fuentes renovables en el año 2025.

Aparte de este primer acuerdo en Indonesia, Gamesa también está presente en otros países del continente asiático como Vietnam, Filipinas, Taiwán, Corea del Sur, Japón, Sri Lanka, China o India, donde ha instalado más de 8.000 MW.

Excelencia tecnológica
Las turbinas de 2,625 MW, basadas en la tecnología probada y validada de la plataforma Gamesa 2.0, presentan tres tamaños de rotores de 106, 114 y 126 metros. De esta forma, incrementan la potencia nominal hasta 2,625 MW, lo que permite aumentar la producción energética del aerogenerador y reducir el Coste de Energía.


Gamesa to supply the wind turbines for Indonesia's first wind farm

$
0
0
Gamesa, a global technology leader in wind energy, has entered into an agreement with PT UPC Sidrap Bayu Energi - a joint venture owned by UPC Renewables, PT Binatek and AC Energy Holdings- for the supply of 75 MW for the first wind farm ever to be commissioned in Indonesia, a high-potential wind market.

This order also constitutes a sales and product milestone for Gamesa as it marks the first time its G114-2.5 MW model will be installed in Asia-Pacific. These turbines will reach up to 2.625 MW under certain technical conditions.
Specifically, the company will commission 30 of these turbines at the Sidrap wind farm, located on the island of Sulawesi. The machines are slated for delivery during the third quarter of this year and the project is due to be commissioned in the first quarter of 2018.
This project is part of the Indonesian government program to reach 35 GW by 2019, combining traditional and renewable sources. Longer term, its goal is to have 23% of output generated from renewable sources by 2025.
Besides this maiden order in Indonesia, Gamesa's Asian footprint also extends to Vietnam, Philippines, Taiwan, South Korea, Japan, Sri Lanka, China and India, having installed over 8,000 MW in these markets.
Technological excellence
Gamesa's 2.5-MW turbines, which are underpinned by the technology proven and validated in its 2.0-MW platform, come in three rotor sizes: 106, 114 and 126 metres.
With optimized models for medium and low wind locations, their higher nominal capacity in turn delivers higher output and a lower cost of energy.


La mitad de la nueva potencia instalada en Europa en 2016 fue eólica

$
0
0
El 51% de las nuevas instalaciones energéticas de la Unión Europea en 2016 fueron eólicas, según datos de la asociación eólica europea WindEurope. Con 12.500 nuevos megavatios en el año y una potencia total de 153.100 MW, la eólica cubrió el 10,4% de la demanda eléctrica europea en 2016. De los nuevos megavatios instalados el año pasado, 10.923 son de eólica terrestre y 1.567 pertenecen a instalaciones marinas. La inversión en el sector alcanzó un récord de 27.500 millones de euros en el año.

En el ranking por países, Alemania es el que más instaló, con 5.443 MW, un 44% del total europeo. Le siguen Francia (1.561 MW), Holanda (887), Reino Unido (736) y Polonia (682). España está en los últimos puestos como consecuencia de la parálisis de las inversiones tras la Reforma Energética. Más de la mitad de los países europeos no invirtió nada en eólica el año pasado. ‘’La política es clave, especialmente a largo plazo. Los países deben empezar a definir en sus Planes Nacionales de Energía y Clima la forma en que realizarán la transición energética a nivel nacional’’, indica Giles Dickson, director general de WindEurope. Añade que ‘’la eólica es una tecnología madura y significativa que da empleo a 330.000 personas en Europa y exporta tecnología por valor de miles de millones de euros’’.
Las energías renovables representaron el 86% de las nuevas instalaciones de centrales eléctricas de la Unión Europea en 2016 (21.100 MW de 24.500 MW).
En España, la potencia eólica aumentó el año pasado en 38 MW, lo que situaba el total a 31 de diciembre de 2016 en 23.026 MW. En los últimos tres años, sólo se han instalado en el país 65 MW eólicos, frente a los 2.334 MW del trienio anterior ((para conocer todos los datos sobre España, pincha aquí). Aún así, España sigue siendo el segundo país por capacidad instalada (23.026 MW), tras Alemania (50.000 MW).
WindEurope ha creado la herramienta Daily Wind en la que podrás consultar la generación eólica diaria en los países europeos y su cobertura de la demanda eléctrica.
Pincha aquí para consultar la nota de prensa de WindEurope sobre la potencia eólica instalada en Europa en 2016 y el informe con las cifras anuales.
Aspas de Fernando Zamarbide (Fotografía participante del Concurso Eolo 2014 de AEE)


Wind in power: 2016 European statistics

$
0
0
Wind accounted for 51% of all new power installations in 2016, connecting a total of 12.5 GW to the grid across the 28 EU Member States – 10.923 MW in onshore and 1,567 MW offshore.

Europe installed 12.5 GW of gross additional wind capacity in 2016. This was 3% less than the new installations in 2015. With a total installed capacity of 153.7 GW, wind energy now overtakes coal as the second largest form of power generation capacity in Europe.
Total wind capacity in Europe now stands at 153.7 GW. Wind energy covered 10.4% of Europe’s electricity needs last year.  Germany installed the most new wind power: 44% of the EU total.  Five Member States had a record year: France, the Netherlands, Finland, Ireland and Lithuania. Renewables altogether accounted for 86% of new EU power plant installations in 2016 – 21.1GW of 24.5 GW.
Investment in new onshore and offshore wind farms reached a record €27.5bn.  Offshore wind investments rose 39% year on year to €18.2bn, while onshore investments were down 29% at €9.3bn.
Giles Dickson, Chief Executive Officer of WindEurope, said: “Wind energy is now a mainstream and essential part of Europe’s electricity supply. It is also a mature and significant industry in its own right, now providing 330,000 jobs and billions of euros of European exports.
“With all the talk about the transition to low-carbon, things should be looking good long-term for the wind industry in Europe. But they’re not. Government policy on energy across Europe is less clear and ambitious than it was a few years ago.  Only 7 out of 28 EU Member States have targets and policies in place for renewables beyond 2020.  The transition from feed-in tariffs to auctions has been less smooth than we hoped.  We still have dysfunctional electricity markets that are not fit for renewables.  And we’re lacking long-term price signals to support investment.”
Dickson added: “We saw strong expansion in Germany in 2016 but growth remains uneven geographically.  Over half the Member States invested nothing in wind energy last year. Policy is key, especially when we look at the longer term. The Member States also need to start defining in their National Energy and Climate Plans how they will deliver the transition at national level. The Clean Energy Package is the blueprint for this. The Council and the European Parliament need to start working seriously on the Commission’s proposals.”

2016 annual figures

  • 12.5 GW of new wind power capacity was installed and grid-connected in the EU during 2016, a decrease of 3% compared to 2015 annual installations. 10,923 MW were installed onshore, and 1,567 MW were installed offshore.
  • Wind power installed more than any other form of power generation in Europe in 2016. Wind power accounted for 51% of total power capacity installations.
  • Renewable energy accounted for 86% of all new EU power installations in 2016: 21.1 GW of a total 24.5 GW of new power capacity.
  • With almost 300 TWh generated in 2016, wind power covered 10.4 % of the EU’s electricity demand.
  • €27.5 billion were invested in 2016 to finance wind energy development. This was 5% more than the total investment in 2015.


Near-record growth propels wind power into first place as America’s largest renewable resource

$
0
0
American wind power just achieved its second strongest quarter ever for newly installed energy generating capacity according to a new report released today by the American Wind Energy Association (AWEA). Wind surpassed hydropower dams to become the largest source of renewable electric capacity in the U.S., and the fourth largest overall.  

Business leaders from General Motors and the U.S. wind energy industry met Thursday morning to mark this historic milestone and release AWEA’s Fourth Quarter 2016 U.S. Wind Industry Market Report at General Motor’s Arlington Assembly Plant, which will soon be 100 percent wind-powered.
“American wind power is now the #1 source of renewable capacity, thanks to more than 100,000 wind workers across all 50 states,” said Tom Kiernan, AWEA CEO. “Growing this made-in-the-USA clean energy resource helps rural communities pay for new roads, bridges, and schools, while bringing back manufacturing jobs to the Rust Belt. With our two-thirds cost reduction over the last seven years, household brands like General Motors, Walmart, and more are buying low-cost wind energy to cut costs and power their businesses. American wind power is on track to double our output over the next five years, and supply 10 percent of U.S. electricity by 2020.”
“With more wind energy production and more wind workers than any other state, if you want to know how wind works for America, just ask a Texan,” added Kiernan.
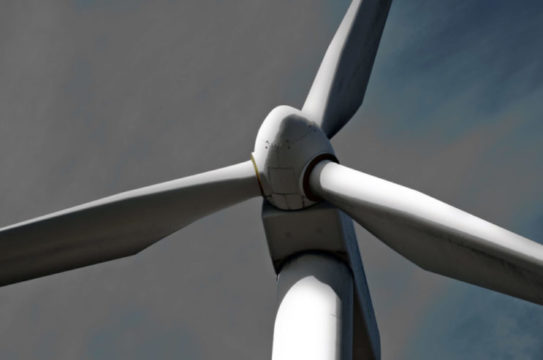
At the close of 2016, the American wind fleet totaled 82,183 MW, enough to power 24 million average American homes. And with the addition of North Carolina’s first utility-scale wind farm announced earlier today, there are now more than 52,000 individual wind turbines in 41 states plus Guam and Puerto Rico.
GM’s Arlington Assembly Plant produces over 1,000 SUVs a day and is 50 percent powered by wind energy today. Starting in 2018, Arlington Assembly will be GM’s first plant to have all of its electricity needs met with wind energy. The company purchases energy from two Texas wind farms, RES’s Cactus Flats in Concho County and EDPR’s Los Mirasoles Wind Farm in Edinburg. Non-utility purchasers, like GM, Microsoft, and the Department of Defense, represent 39 percent of wind purchased through long-term contracts in 2016, totaling 1,574 megawatts (MW). More than half of that capacity is located in Texas.
“At GM, we’re committed to efforts in our facilities that create business value and strengthen communities where we live and work,” said Rob Threlkeld, GM global manager of renewable energy. “Using wind power delivers on this by securing more stable energy costs while reducing our impact on the environment.” While buying low-cost wind energy helps make other industries more competitive, building wind turbines is also big business in the U.S. The wind industry employs 25,000 Americans at over 500 factories in 43 states. This includes 40 wind manufacturing facilities across Texas. In 2016, at least seven companies across the U.S. expanded existing manufacturing facilities to meet growing orders, and GRI Renewable Industries opened a new tower facility in Amarillo, Texas.
Over 100,000 American workers now manufacture, construct, and maintain the U.S. wind turbine fleet according to the U.S. Department of Energy. In total, wind supports more American jobs than nuclear, natural gas, coal, or hydroelectric power plants.
New growth in the fourth quarter of 2016, announced for the first time today, includes 6,478 MW, the second strongest quarter for U.S. wind power installations on record. For the year, wind developers added 8,203 MW of wind power capacity representing more than $13.8 billion in new investment. With 99 percent of wind projects located in rural areas, much of this investment is flowing to communities that need it most.
Rural and Rust Belt America are among the greatest beneficiaries of wind power development. Wind projects in these areas often become the largest contributors to the property tax base, helping to improve schools, roads and other public services. Of the $13.8 billion invested by the U.S. wind industry last year, $10.5 billion was invested in low-income counties.
Wind is a new drought-resistant cash crop for farmers and ranchers who host wind turbines on their land. Nationwide, wind projects provide private landowners with more than $245 million in land lease payments annually. Texas landowners receive more than $60 million of that, in many cases helping to keep farms and ranches in their families.
Wind power is in high demand from utilities and other buyers because it often provides the least expensive energy available. Wind power can bring costs down further and create American jobs thanks to policy stability that passed in 2015 with bipartisan support in Congress.
“Wind power isn’t a red or blue industry, it’s red, white and blue,” said Kiernan. “Low-cost, homegrown wind energy is something we can all agree on. States like Texas and Iowa are leading the way in terms of wind turbines and wind jobs.”
Texas is the undisputed leader in wind energy, with approximately three times more wind generating capacity than any other state and nearly a quarter of American wind jobs. The state continues to expand wind power, becoming the first state to pass 20,000 MW of wind capacity last year, which is roughly one-fourth of national capacity. More wind is on the way in Texas. Even with the 1,790 MW installed in the fourth quarter of 2016, there is still 5,401 MW under construction and another 1,288 MW in advanced development.
The Texas model for energy development stems from genuine commitment to an “all of the above” energy mix.  Free markets allowed wind to prosper in Texas, creating a low-cost, balanced energy portfolio for the state. Texas has captured $38 billion in wind investment to date and supports up to 25,000 wind jobs today The state has also benefited from investment by corporate energy buyers who want to site data centers and factories close to the wind farms that power their facilities.
A key part of the success story in Texas has been a strong backbone of transmission infrastructure – the power lines that deliver all forms of energy to homes and businesses. Texas’s CREZ (Competitive Renewable Energy Zone) transmission lines and the state’s long-standing recognition that a strong grid is essential for a free market in electricity have become the national model for transmission investments that more than pay for themselves. Looking ahead, transmission projects like Pattern Development’s proposed Southern Cross Transmission Project will allow Texas to benefit by exporting its abundant wind energy to customers in the Southeast.
Wind power growth is now spreading up from Texas into the Plains states and across the Midwest. In fact, 89 percent of newly completed capacity in 2016 is found in these states. The U.S. offshore wind industry also launched in the fourth quarter of 2016 with the commissioning of the 30 MW Block Island Wind Farm off the coast of Rhode Island. Gulf Island Fabrication in Louisiana manufactured the foundations for the Block Island project, reflecting a broader opportunity for oil and gas suppliers to earn additional business in offshore wind. 
As a result of the generating capacity of wind turbines in the U.S. standing at over 82,000 MW, greater than the 80,000 MW of hydropower generating capacity, wind power is now the fourth largest source of generating capacity, behind gas, coal, and nuclear.


Eólica en Tailandia: Gamesa suministra 20 aerogeneradores para el promotor Gunkul Engineering Public Company Limited

$
0
0
Gamesa cierra el primer contrato de su turbina eólica G126-2.625 MW: suministrará 52,5 MW en Tailandia.

Gamesa, líder tecnológico global en la industria eólica, continúa reforzando su estrategia comercial y de producto al firmar el primer contrato de su nuevo modelo de turbina G126-2.625 MW, una máquina que obtiene la máxima producción en zonas de vientos bajos.

En concreto, la compañía ha llegado a un acuerdo con el promotor tailandés Gunkul Engineering Public Company Limited para el suministro de 20 aerogeneradores (52,5 MW) al parque eólico Mittraphap, localizado en la provincia de Nakhon Ratchasima, al sur del país. Por su parte, la compañía PowerChina Zhongnan Engineering Corporation se encargará de la construcción llave en mano del proyecto.

La entrega de las máquinas se llevará a cabo en el tercer trimestre de este año y su puesta en marcha durante el primer trimestre de 2018. Además, Gamesa se encargará del mantenimiento del parque durante los próximos 10 años.

Este acuerdo supone el tercer contrato que la compañía firma en Tailandia, tras acordar el suministro de otros 127,5 MW para este mismo cliente, Gunkul Engineering Public Company Limited, la principal compañía promotora de energías renovables en Tailandia que desarrolla  proyectos de energía eólica y solar en los países del sudeste asiático y Japón.

Aerogenerador G126, excelencia tecnológica
Esta nueva máquina conjuga un mayor rotor -de 126 metros de diámetro-, con una potencia nominal de 2.5 MW o 2.625 MW, así como varias posibilidades de altura de torre (84, 102 y 129 metros y otras adaptaciones según el emplazamiento).

Además, con una densidad de potencia extremadamente baja, un excelente factor de capacidad y un coste de energía reducido, este aerogenerador aumenta la producción energética de la turbina G114-2.0 MW hasta un 25%.


Gamesa will supply 52.5 MW in Thailand

$
0
0
Gamesa, a global technology leader in wind energy, continues to shore up its sales and product strategy, having secured the first order  for its new turbine, the G126-2.625 MW, a product which delivers maximum output in low wind speed conditions.

More specifically, the company has entered into an agreement with Thailand’s developer, Gunkul Engineering Public Company Limited, for the supply of 20 of these turbines (52.5 MW) at the Mittraphap wind farm, located in the province of Nakhon Ratchasima, in southern Thailand. PowerChina Zhongnan Engineering Corporation will carry out the engineering procurement and construction for this project.
The turbines are slated for delivery during the third quarter of this year and the project is due to be commissioned in the first quarter of 2018. In addition, Gamesa will maintain the complex for the next 10 years.
This agreement marks the company’s third order in Thailand, having already been contracted to supply another 127.5 MW for this same customer. Gunkul Engineering Public Company Limited is the investment leader in renewable energy industry in Thailand. The company developed and invested in renewable energy including wind and solar power in ASEAN countries and Japan.
The G126, technological excellence
This new turbine combines a longer rotor (126 metres in diameter), nominal capacity of 2.5 MW or 2.625 MW and a range of tower heights to choose from (84, 102 and 129 metres, among other customisable features depending on site conditions).
Moreover, thanks to its extremely low power density, an outstanding capacity factor and a low cost of energy, this turbine boosts energy production with respect to the G114-2.0 MW turbine by up to 25%.

China, EEUU, Alemania e India acercan la potencia eólica mundial al medio millón de megavatios

$
0
0
2016 acabó con una potencia eólica de 486.749 MW en el mundo, según datos del Consejo Mundial de Energía Eólica (GWEC). En total, se instalaron 54.600 MW en el mundo en 2016, un 14,1% menos que en 2015, año en que se instaló la cifra récord de 63.633 MW.

China, EEUU, Alemania e India fueron los países que más potencia instalaron en el año y continúan siendo los líderes a nivel mundial. El país más activo en 2016 fue China que, con 23.328 nuevos megavatios eólicos, instaló en un año lo mismo que España en sus más de veinte años de historia eólica. La actividad de los otros tres líderes superó los 3.000 MW nuevos en el año (ver gráfico). En cuanto a España, que 2015 fue adelantada por India, se mantiene en el quinto puesto a pesar de haber instalado sólo 38 MW en 2016 como consecuencia de la parálisis que afecta al mercado desde la Reforma Energética.
El quinto país que más ha instalado en 2016 ha sido Brasil, con 2.000 MW, y sigue liderando el mercado latinoamericano. Chile registró un año récord con 513 MW instalados, elevando el total del país a 1.424 MW. Uruguay sumó 365 MW hasta un total de 1.210 MW. Perú (93 MW), República Dominicana (50 MW) y Costa Rica (20 MW) también tuvieron un importante desarrollo en 2016. Argentina, por su parte, no ha crecido en el año pero tiene en cartera más de 1.400 MW que se construirán en los próximos años.
África no ha tenido un gran crecimiento en 2016, con sólo 418 MW instalados en Sudáfrica. La región de Asia Pacífico tampoco ha registrado movimientos; sólo Australia ha instalado 140 MW en 2016.
En Europa, se ha registrado un récord de inversión eólica de 27.500 millones; la mitad de la nueva potencia instalada en el año en el continente fue eólica, según datos de la asociación eólica europea WindEurope. Con 12.500 nuevos megavatios en el año y una potencia total de 153.100 MW, la eólica cubrió el 10,4% de la demanda eléctrica europea en 2016. De los nuevos megavatios instalados el año pasado, 10.923 son de eólica terrestre y 1.567 pertenecen a instalaciones marinas (ver informe de Wind Europe).
En el ranking por países, Alemania es el que más instaló, con 5.443 MW, un 44% del total europeo. Le siguen Francia (1.561 MW), Holanda (887), Reino Unido (736) y Polonia (682). España está en los últimos puestos como consecuencia de la parálisis de las inversiones tras la Reforma Energética (para consultar los datos españoles, pincha aquí).
El ranking por potencia acumulada en el mundo lo lidera China con 168.690 MW y le siguen EEUU (82.184), Alemania (50.018) e India (28.700), como se puede ver en el gráfico.
Para consultar el informe de GWEC, pincha aquí.


Wind Power Chalks Up More Strong Numbers

$
0
0
The Global Wind Energy Council released its annual market statistics today: the 2016 market was more than 54 GW, bringing total global installed capacity to nearly 487 GW. Led by China, the US, Germany, and India; and with surprisingly strong showings from France, Turkey and the Netherlands, the global market was nonetheless less than 2015’s record total.


“Wind power continues to grow in double digits; but we can’t expect the industry to set a new record every single year”, said Steve Sawyer, GWEC Secretary General. “Chinese installations were an impressive 23,328 MW, although this was less than 2015’s spectacular 30 GW, which was driven by impending feed-in tariff reductions. Also, Chinese electricity demand growth is slackening, and the grid is unable to handle the volume of new wind capacity additions; although we expect the market to pick up again in 2017.” The Chinese offshore market began what many hope is the sector’s long awaited take-off in 2016, with China passing Denmark to achieve 3rd place in the global offshore rankings, after the UK and Germany.
http://cached.imagescaler.hbpl.co.uk/resize/scaleWidth/460/offlinehbpl.hbpl.co.uk/news/OPW/GWEC_GlobalCumulativeInstalledWindCapacity_2009to2016-20170210112730101.jpg 
Global wind capacity nears 500GW
 
US installations (8,203 MW) were nearly equal to 2015’s strong market, bringing the US total to more than 82 GW. The US industry now employs more than 100,000 people and has more than 18 GW under construction or in advanced stages of development, a harbinger for a strong market again in 2017. Canada (702 MW) and Mexico (454 MW) posted solid though modest gains.
http://www.sunwindenergy.com/sites/default/files/wind_gwec_statistics_1.jpg
India set a new national record with 3,612 MW of new installations, 2016’s 4th largest market; this brings the country’s total to 28,700 MW, consolidating its 4th position in total cumulative installations as well. “We have great expectations for the Indian market”, continued Sawyer, “and we look forward to seeing offshore making a contribution in India in the next few years.”
Europe had a surprisingly strong year, given the policy uncertainty which plagues the region, posting modest gains with an annual market of 13,926 MW of which the EU-28 contributed 12,491 MW. Germany also had another strong year, installing 5,443 MW to bring its total capacity to more than 50 GW, only the third country to reach that milestone. France had a strong year with more than 1,500 MW, and Turkey broke the 1 GW barrier for the first time, installing 1,387 MW. The Netherlands entered the global top 10 in terms of annual market for the first time, with 887 MW, most of which was offshore.
“The cost of wind power continues to plummet, and this is particularly the case for the European offshore sector, which has met and exceeded its 2020 price targets by a substantial margin, and five years early”, according to Sawyer.
Brazil once again led the Latin America market, although the country’s political and economic woes resulted in a market which barely cleared 2 GW (2,014 MW), but which still pushed the country over the 10 GW mark as it ended the year with 10,740 MW. Chile posted a record year with 513 MW installed, bringing the country’s total to 1,424 MW, and Uruguay added 365 MW for a year-end total of 1,210 MW. Peru (93 MW), the Dominican Republic (50 MW) and Costa Rica (20 MW) also had significant installations last year. While Argentina had no new installations in 2016, it now has a solid pipeline of more than 1,400 MW which will be built out over the next couple of years.
Africa was quiet, with only 418 MW installed in South Africa, whose Renewable Power Programme is currently being held hostage to a power struggle between the president, his cronies and Eskom on the one hand; and the energy regulator, the Ministry and the industry on the other. Elsewhere, Morocco had a successful auction for 800+ MW of wind which will be built out over the coming years, construction was nearly finished on the Lake Turkana project in Kenya; but Egypt’s renewable ambitions seem to be stuck for the moment.
The Asia Pacific region was also quiet, with only Australia adding capacity (140 MW) although there are signs of a strong revival in the Australian market.
“Overall, the industry is in pretty good shape”, concluded Sawyer, “with new markets emerging across Africa, Asia and Latin America, and the traditional markets in China, the US and Germany continuing to perform well. We look forward to a strong 2017.”
Download full report here
Global installed wind power capacity in 2016 – regional distributionTop ten new installed capacity in 2016
Top ten cumulative installed capacity in 2016
Annual installed global capacity 2001-2016
Global cumulative Installed capacity 2001-2016
Annual installed capacity by region 2008-2016
Global cumulative and annual offshore wind capacity end 2016


La eólica sí es gestionable

$
0
0
Un total de 5.700 MW eólicos se han unido ya a las tecnologías convencionales en los conocidos como mercados y servicios de ajuste, que son gestionados por REE y garantizan la seguridad de suministro.

Acciona, EDPR, Enel Green Power España, Gas Natural Fenosa Renovables, Iberdrola, RWE Innogy y Viesgo Renovables figuran entre las empresas que ya participan.
Una vez más, España está demostrando su condición de potencia tecnológica eólica.
El pasado sábado 11 de febrero se cumplió un año desde que nuestro país se convirtió en el primero del mundo en el que se permite a las energías renovables participar en los mercados de balance, diseñados para que la generación eléctrica se adapte en todo momento a la demanda y el sistema eléctrico esté siempre equilibrado, de modo que se garantice la seguridad de suministro. Son los conocidos como servicios o mercados de ajuste, en los que las empresas cobran por su participación.
Las energías renovables cubrieron el 33,9% de la demanda eléctrica en julio: eólica el 12,7%, energía solar fotovoltaica el 4,6%,termosolar el 3,1%, hidráulica el 11,6% y biomasa el 1,9%. La demanda de energía eléctrica desciende un 3,2% en julio.
Las energías renovables son fuentes de generación primaria de naturaleza intermitente, por lo que la regulación no permitía que participaran en estos servicios, que gestiona el operador del sistema, Red Eléctrica de España (REE). Pero la madurez y el volumen alcanzados en los últimos años, fundamentalmente por la eólica, han impulsado este importante cambio de regulación en el que España es pionera. En la Unión Europea, la propuesta de Directiva de Balance Eléctrico sobre reglas comunes para el mercado interno de la electricidad establece que las energías renovables tendrán acceso a los servicios de ajuste, por lo que es cuestión de tiempo que otros estados miembros se sumen a España y el país pueda servir, una vez más, de ejemplo.

Ya son 5.700 MW eólicos (el 25% del total de potencia eólica instalada) los que pueden participar en los servicios de gestión de desvíos y regulación terciaria, dos de los servicios de ajuste del sistema, tras haber superado con éxito las pruebas de habilitación. Alrededor de la mitad de los 23.000 MW de potencia instalada eólica que hay en el sistema eléctrico peninsular ha solicitado realizar las pruebas de habilitación para poder hacerlo. Algunas de las empresas eólicas que están participando con éxito en estos servicios son Acciona, EDPR, Enel Green Power España, Gas Natural Fenosa Renovables, Iberdrola, RWE Innogy y Viesgo Renovables, entre otras.

Aunque no es posible atribuirlo a la presencia de la eólica, lo cierto es que los costes de los servicios de ajuste en los que participa se han reducido considerablemente en 2016. En el caso de la regulación terciaria, que tiene por objeto resolver los desvíos entre generación y consumo y restituir la reserva de regulación secundaria utilizada, el precio medio ponderado, en euros por MWh, del servicio de energía a subir ha bajado un 21%; el de energía a bajar, un 22%.

En el caso de la gestión de desvíos, que tiene por objeto resolver los desvíos entre generación y consumo que pudieran identificarse con posterioridad al cierre de cada sesión del mercado intradiario, el precio medio ponderado del servicio de energía a subir ha descendido un 23%; el de energía a bajar, un 21%.
Asociación Empresarial Eólica es la voz del sector eólico en España y defiende sus intereses. Con cerca de 200 empresas asociadas, representa a más del 90% del sector en el país, que incluye a promotores, fabricantes de aerogeneradores y componentes, asociaciones nacionales y regionales, organizaciones ligadas al sector, consultores, abogados y entidades financieras y aseguradoras, entre otros.

China leads with wind energy

$
0
0
2016 saw China install 23.3 GW (gigawatt) of new wind capacity, representing 42.7 percent of the total global market share, according to the latest report by the Global Wind Energy Council (GWEC).

The growth in the wind energy sector in the country comes after the National Energy Administration announced plans in December 2016 to spend 700 billion yuan (102 billion US dollars) on wind power by 2020, with the aim of sourcing six percent of the country's total energy needs from wind farms.
The GWEC report found that worldwide, 54.6 GW of new capacity had been added in 2016, a decline from 63.6 GW in 2015. Amid fears that the US will not prioritize renewable energy under the new Trump administration, GWEC Secretary General Steve Sawyer said that "wind power continues to grow in double digits; but we can't expect the industry to set a new record every single year."
China's newly added capacity in wind energy in 2016 also declined from 30 GW in 2015, with Sawyer blaming a decline in demand in the country. He did however estimate that the Chinese market would pick up again this year.
While China is expected to further invest in wind energy over the next few years, the government is also looking at ways to cut waste in the industry and fully tap into the potential of the infrastructure it already has in place.
In 2016, Qin Haiyan, secretary-general of the wind power committee of the Chinese Renewable Energy Society, revealed that in 2015 some 15 percent of wind power across the country was wasted. He attributed this waste to restrictions in place from local authorities, which meant many wind farms could not supply energy to the power grid system. Qin estimated this caused losses of more than 18 billion yuan (2.78 billion US dollars).
According to China Daily, up to 60 percent of energy generated by wind farms in Gansu and Heilongjiang provinces and the Ningxia Hui Autonomous Region was wasted. The five-year-period from 2010-2015 saw 100 billion k/h of energy wasted by wind farms, the equivalent of the total output in 2015 of the Three Gorges Dam and the Gezhouba hydropower plants on the Yangtze, two of the world's largest hydroelectric projects.


Gamesa suministrará 278 MW para siete proyectos de eólica en India

$
0
0
Gamesa  instalará un total de 139 aerogeneradores de los modelos G114-2.0 MW y G97-2.0 MW. 
Gamesa continua reforzando su posicionamiento en India -donde se ha consolidado como el fabricante líder del país por tercer año consecutivo- con la firma de siete nuevos proyectos eólicos. Concretamente, la compañía suministrará un total de 278 MW para varios clientes.
Gamesa llevará a cabo el suministro, instalación y puesta en marcha de las turbinas en todos los proyectos. Además, en tres de ellos, se encargará también de la construcción llave en mano del parque, realizando las tareas de ingeniería civil correspondientes.

En total, Gamesa suministrará 99 turbinas (198 MW) del modelo G114-2.0 y 40 turbinas (80 MW) del modelo G97-2.0 MW. La puesta en marcha de estos proyectos está prevista entre los meses de marzo y octubre de 2017.

Liderazgo en el mercado indio
Presente en India desde 2009, la compañía se ha erigido por tercer año consecutivo como el primer fabricante del país, según la consultora MAKE, aumentando la distancia con el segundo fabricante, al elevar su cuota de mercado desde el 25% en 2014 al 34% en 2015.

Además, Gamesa ha seguido reforzando su actividad industrial en esta región, que supone cerca del 30% de las ventas totales de la compañía. Así, la compañía ha inaugurado recientemente una nueva fábrica en la región de Nellore, en el estado de Andhra Pradesh, que se suma a una planta de palas en Halol (Gujarat), una de nacelles en Mamandur (Chennai, Tamil Nadu) y un centro de reparaciones en Red Hills (Chennai, Tamil Nadu).


Gamesa reaffirms its leadership in India with orders for the supply of 278 MW at seven wind developments

$
0
0
Gamesa continues to reinforce its positioning in India, where the company has ranked as the leading OEM for the last three years, with seven new orders. Specifically, the company will supply a total of 278 MW to several customers.

Gamesa will supply, install and commission the turbines at all seven developments. Three of them are EPC contracts, so that it will also perform the corresponding civil engineering work at these facilities.
In all, Gamesa will supply 99 (198 MW) of its G114-2.0 turbines and 40 (80 MW) of its G97-2.0 MW model. The projects are slated for commissioning between March and October 2017.
Leadership position in India
Present in India since 2009, the company has been the leading OEM in India for the last three years, according to MAKE Consultancy, having increased its gap with respect to the next contender in 2015 when it lifted its market share from 25% to 34%.
In parallel, Gamesa has been reinforcing its industrial capabilities in this region, which accounts for close to 30% of the company's total sales volume. Against this backdrop, the company recently inaugurated a new factory in the Nellore region, in the state of Andhra Pradesh, adding to its blade plant in Halol (Gujarat), nacelle factory in Mamandur (Chennai, Tamil Nadu) and repair centre in Red Hills (Chennai, Tamil Nadu).


Viewing all 10472 articles
Browse latest View live